
We Tested 12 Deep Learning Models on Real Regulatory Data. Here Is What They Actually Do.
Explore Darwin →Quick Summary
Every few months a new deep learning model promises to decode gene regulation. We tested 12 models — protein language models, DNA foundation models, expression models, and structure predictors — against GRN Atlas data: 162,000 candidate regulatory edges across eight species, from Arabidopsis to human.
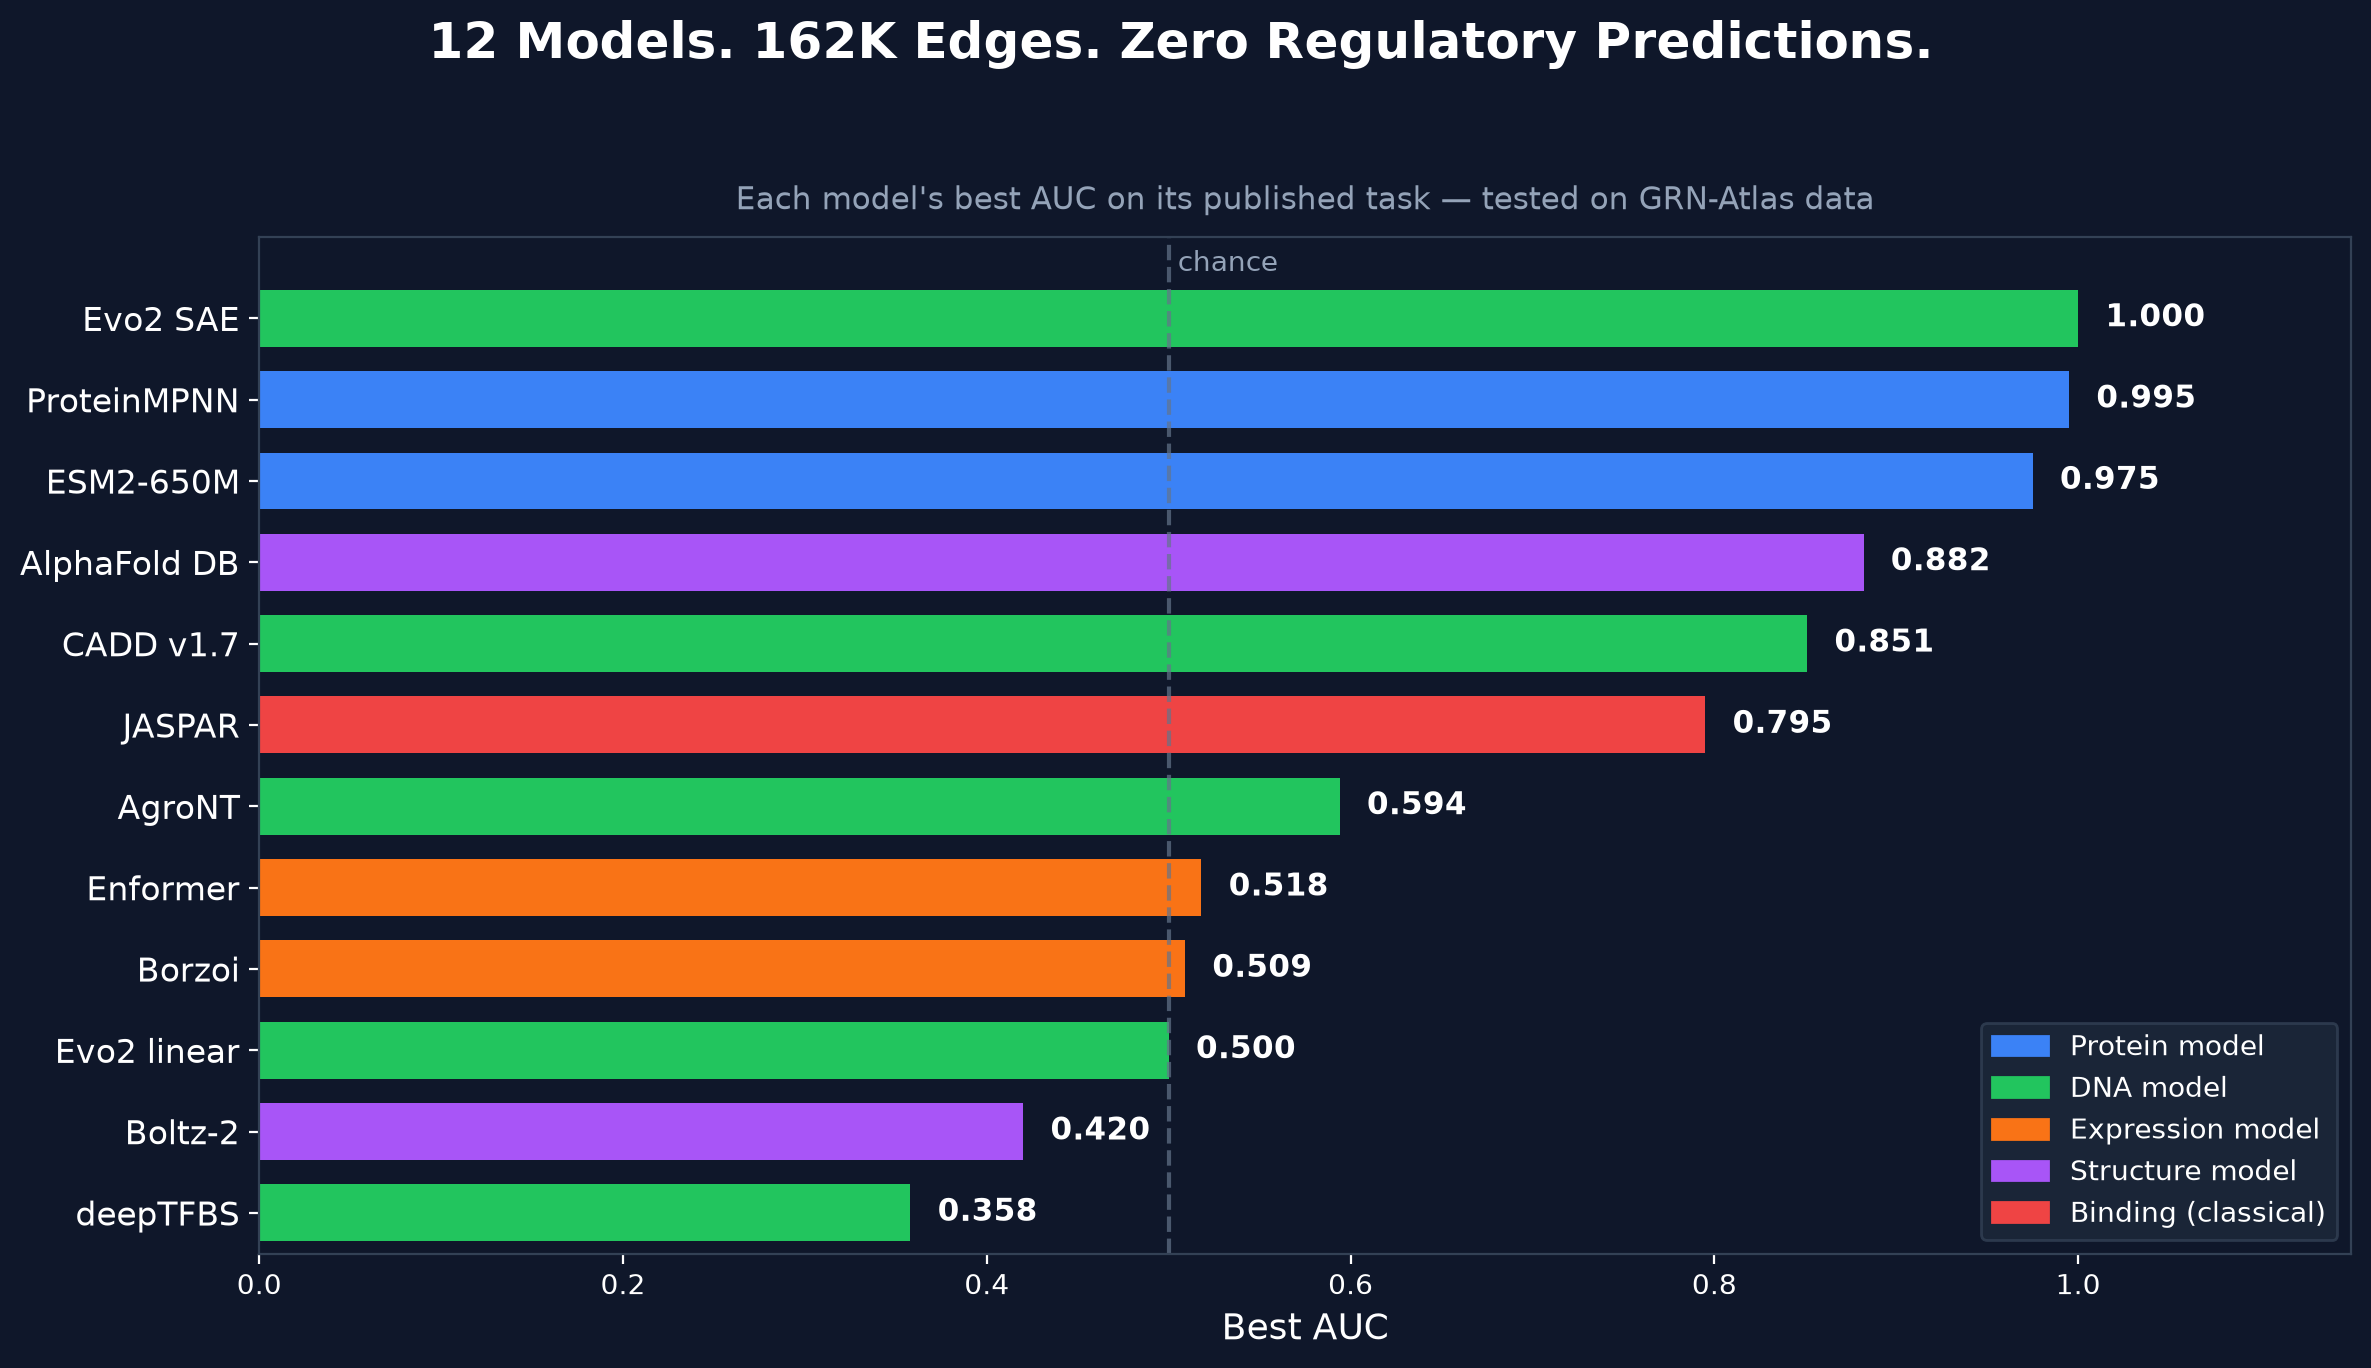
The result is consistent: every model is useful for part of the problem it was trained to solve, but none predicts which genes a transcription factor actually regulates.
The Gap Between Binding and Regulation
We started with a familiar question: can deep learning predict whether a transcription factor binds a target gene’s promoter? We tested 15 approaches, from classical motif scanning to neural models trained on ChIP-seq data and protein-DNA structure prediction.
| Approach | Species | AUC | Result |
|---|---|---|---|
| JASPAR motif scanning | Arabidopsis | 0.795 | Best binding discriminator |
| JASPAR motif scanning | Petunia | 0.715 | Cross-species transfer works |
| AgroNT-1B | Arabidopsis | 0.594 | Weak signal, substantial overfit |
| Boltz-2 | Human | 0.520 | No signal at scale |
| Enformer | Human | 0.518 | Chance level overall at scale |
| Borzoi | Human | 0.509 | Chance level |
| Evo2 linear probe | Arabidopsis | 0.500 | No signal |
| Boltz-2 | Arabidopsis | 0.420 | Below chance |
| deepTFBS | Arabidopsis | 0.358 | Anti-discriminates |
Even perfect binding prediction would not solve network inference. A transcription factor can bind thousands of promoters, while only a subset of those events changes gene expression. The gap between “binds DNA here” and “regulates this gene” remains large.
What Each Model Is Actually Good At
ESM2-650M: transcription-factor classification
Meta’s protein language model was highly effective for protein identity. Its 1,280-dimensional embeddings classified transcription factors against non-TFs at AUC 0.975 in rice and 0.959 in Arabidopsis. It also separated TF families strongly: 12 of 15 Arabidopsis family comparisons reached AUC 1.0. ESM2 does not identify regulatory targets, but it is an effective cross-species TF annotation and family-classification tool.
| Species | n (TF + non-TF) | CV-AUC | Task |
|---|---|---|---|
| Rice | 50 + 50 | 0.975 | TF vs non-TF classification |
| Arabidopsis | 50 + 50 | 0.959 | TF vs non-TF classification |
| Mouse | 50 + 50 | 0.882 | TF vs non-TF classification |
| Human | 50 + 50 | 0.821 | TF vs non-TF classification |
ProteinMPNN: structural designability
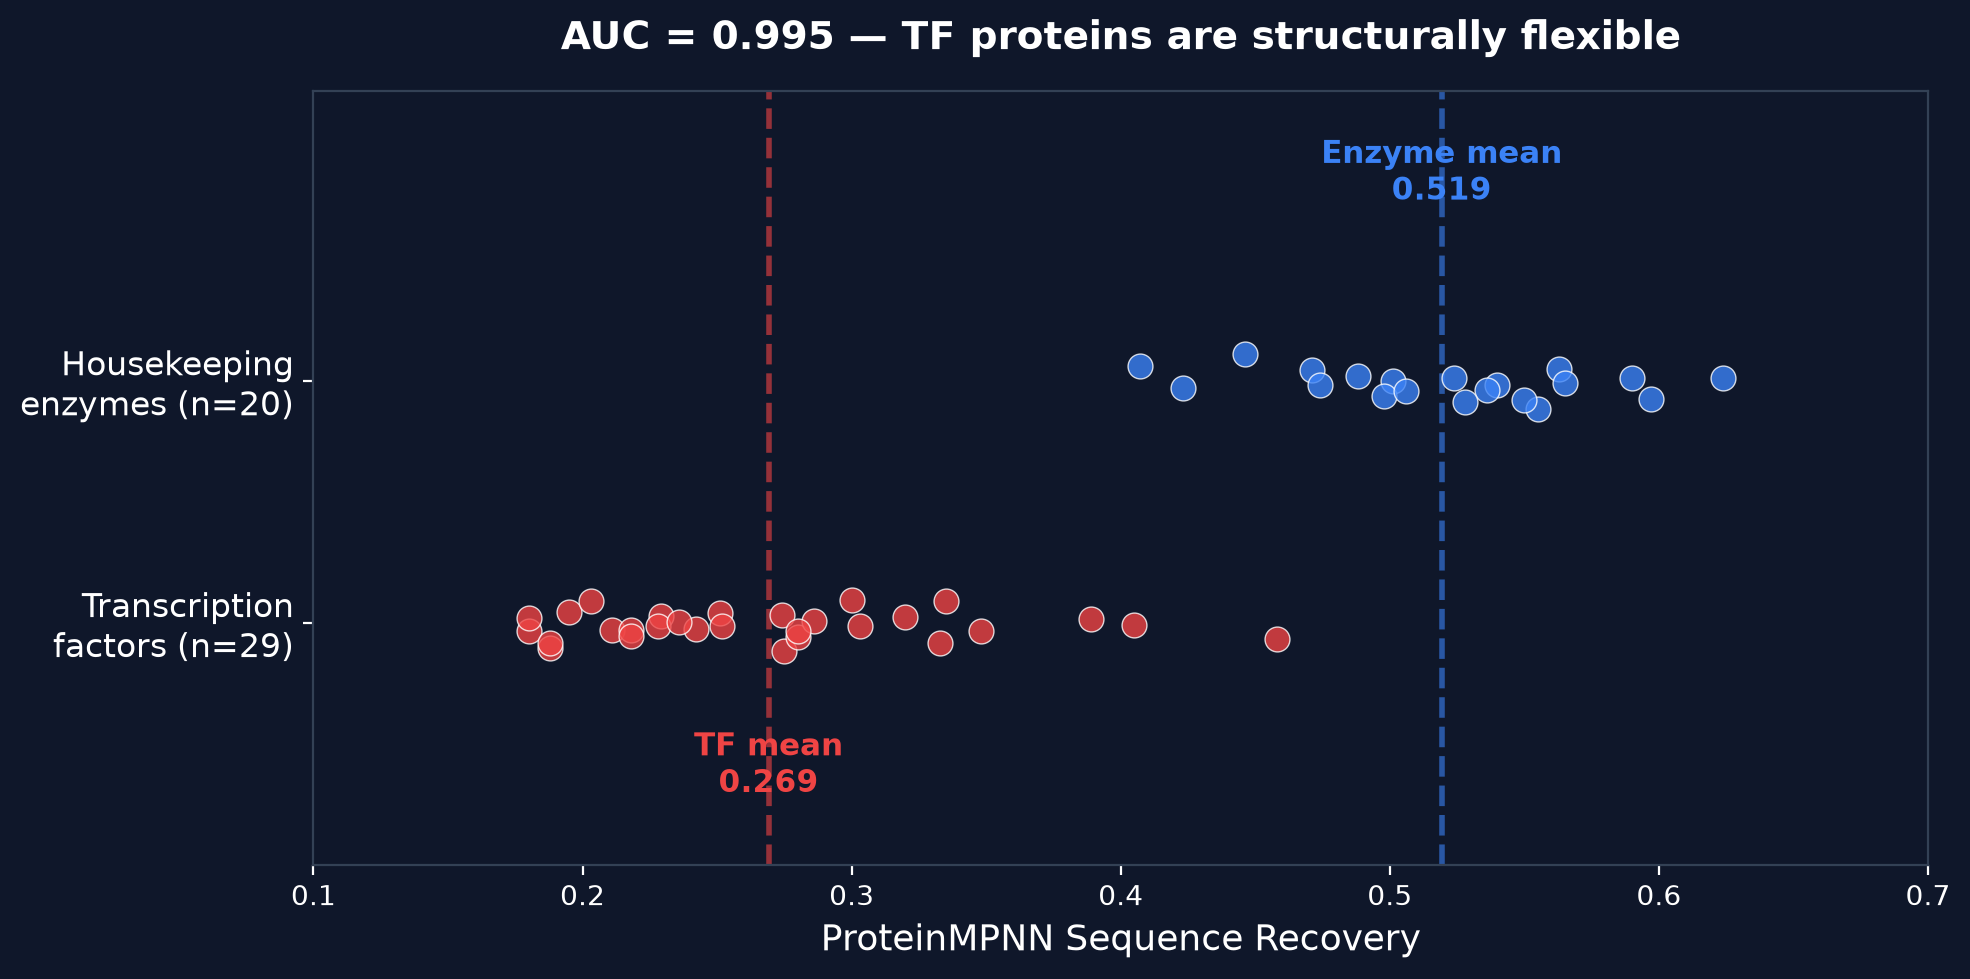
ProteinMPNN produced the strongest single discrimination in the survey: AUC 0.995 separating TFs from housekeeping enzymes by structural designability. TFs averaged 27% sequence recovery compared with 52% for enzymes such as GAPDH and enolase. Their DNA-binding domains and disordered activation regions create backbone geometries that constrain sequence choice differently from those enzymes. This measure does not distinguish TF families as well as ESM2, but it is a powerful structural complement.
AlphaFold DB and CADD: useful context, not wiring
AlphaFold structural confidence provides a complementary TF signal. TFs have lower predicted confidence, reflecting intrinsically disordered regions: AUC 0.882 in Arabidopsis, 0.847 in human, and 0.784 in mouse. CADD v1.7 reliably identifies functionally important human genomic regions (AUC 0.851 for TSS-proximal versus intergenic sequence), but it does not distinguish high-connectivity regulatory hubs from low-connectivity genes (AUC 0.523). Both tools describe important context; neither supplies a regulatory edge.
Evo2: phylogenomic sequence structure
Evo2 Goodfire SAE features perfectly separated species and coding from non-coding sequence in the tested comparisons. They separated Arabidopsis promoters at AUC 0.889, followed a dicot-to-monocot-to-mammal gradient (potato 0.763, rice 0.636, human 0.545, mouse 0.500), and therefore provide useful sequence-context signals. They did not predict TF-DNA binding or regulatory sign.
The Pattern
- Protein models such as ESM2, ProteinMPNN, and AlphaFold characterize TF proteins well, but do not identify regulatory targets.
- DNA models such as Evo2, CADD, and JASPAR classify genomic sequences, but do not predict regulatory connectivity. JASPAR is useful for binding evidence where a motif is known.
- Expression models such as Enformer and Borzoi are trained on sequence-to-expression tasks, not on which transcription factor drives which gene.
No tested model bridges protein identity to regulatory function. That bridge requires binding evidence, perturbation data, expression patterns, evolutionary conservation, and chromatin state: the multi-evidence synthesis GRN Atlas is designed to support.
Species Coverage
Model performance depends strongly on the relationship between the target organism and a model’s training domain. ESM2 was the broadest tool tested, performing well across Arabidopsis, human, mouse, and rice. JASPAR transferred effectively across Arabidopsis and petunia. Most neural approaches were constrained to human or Arabidopsis.
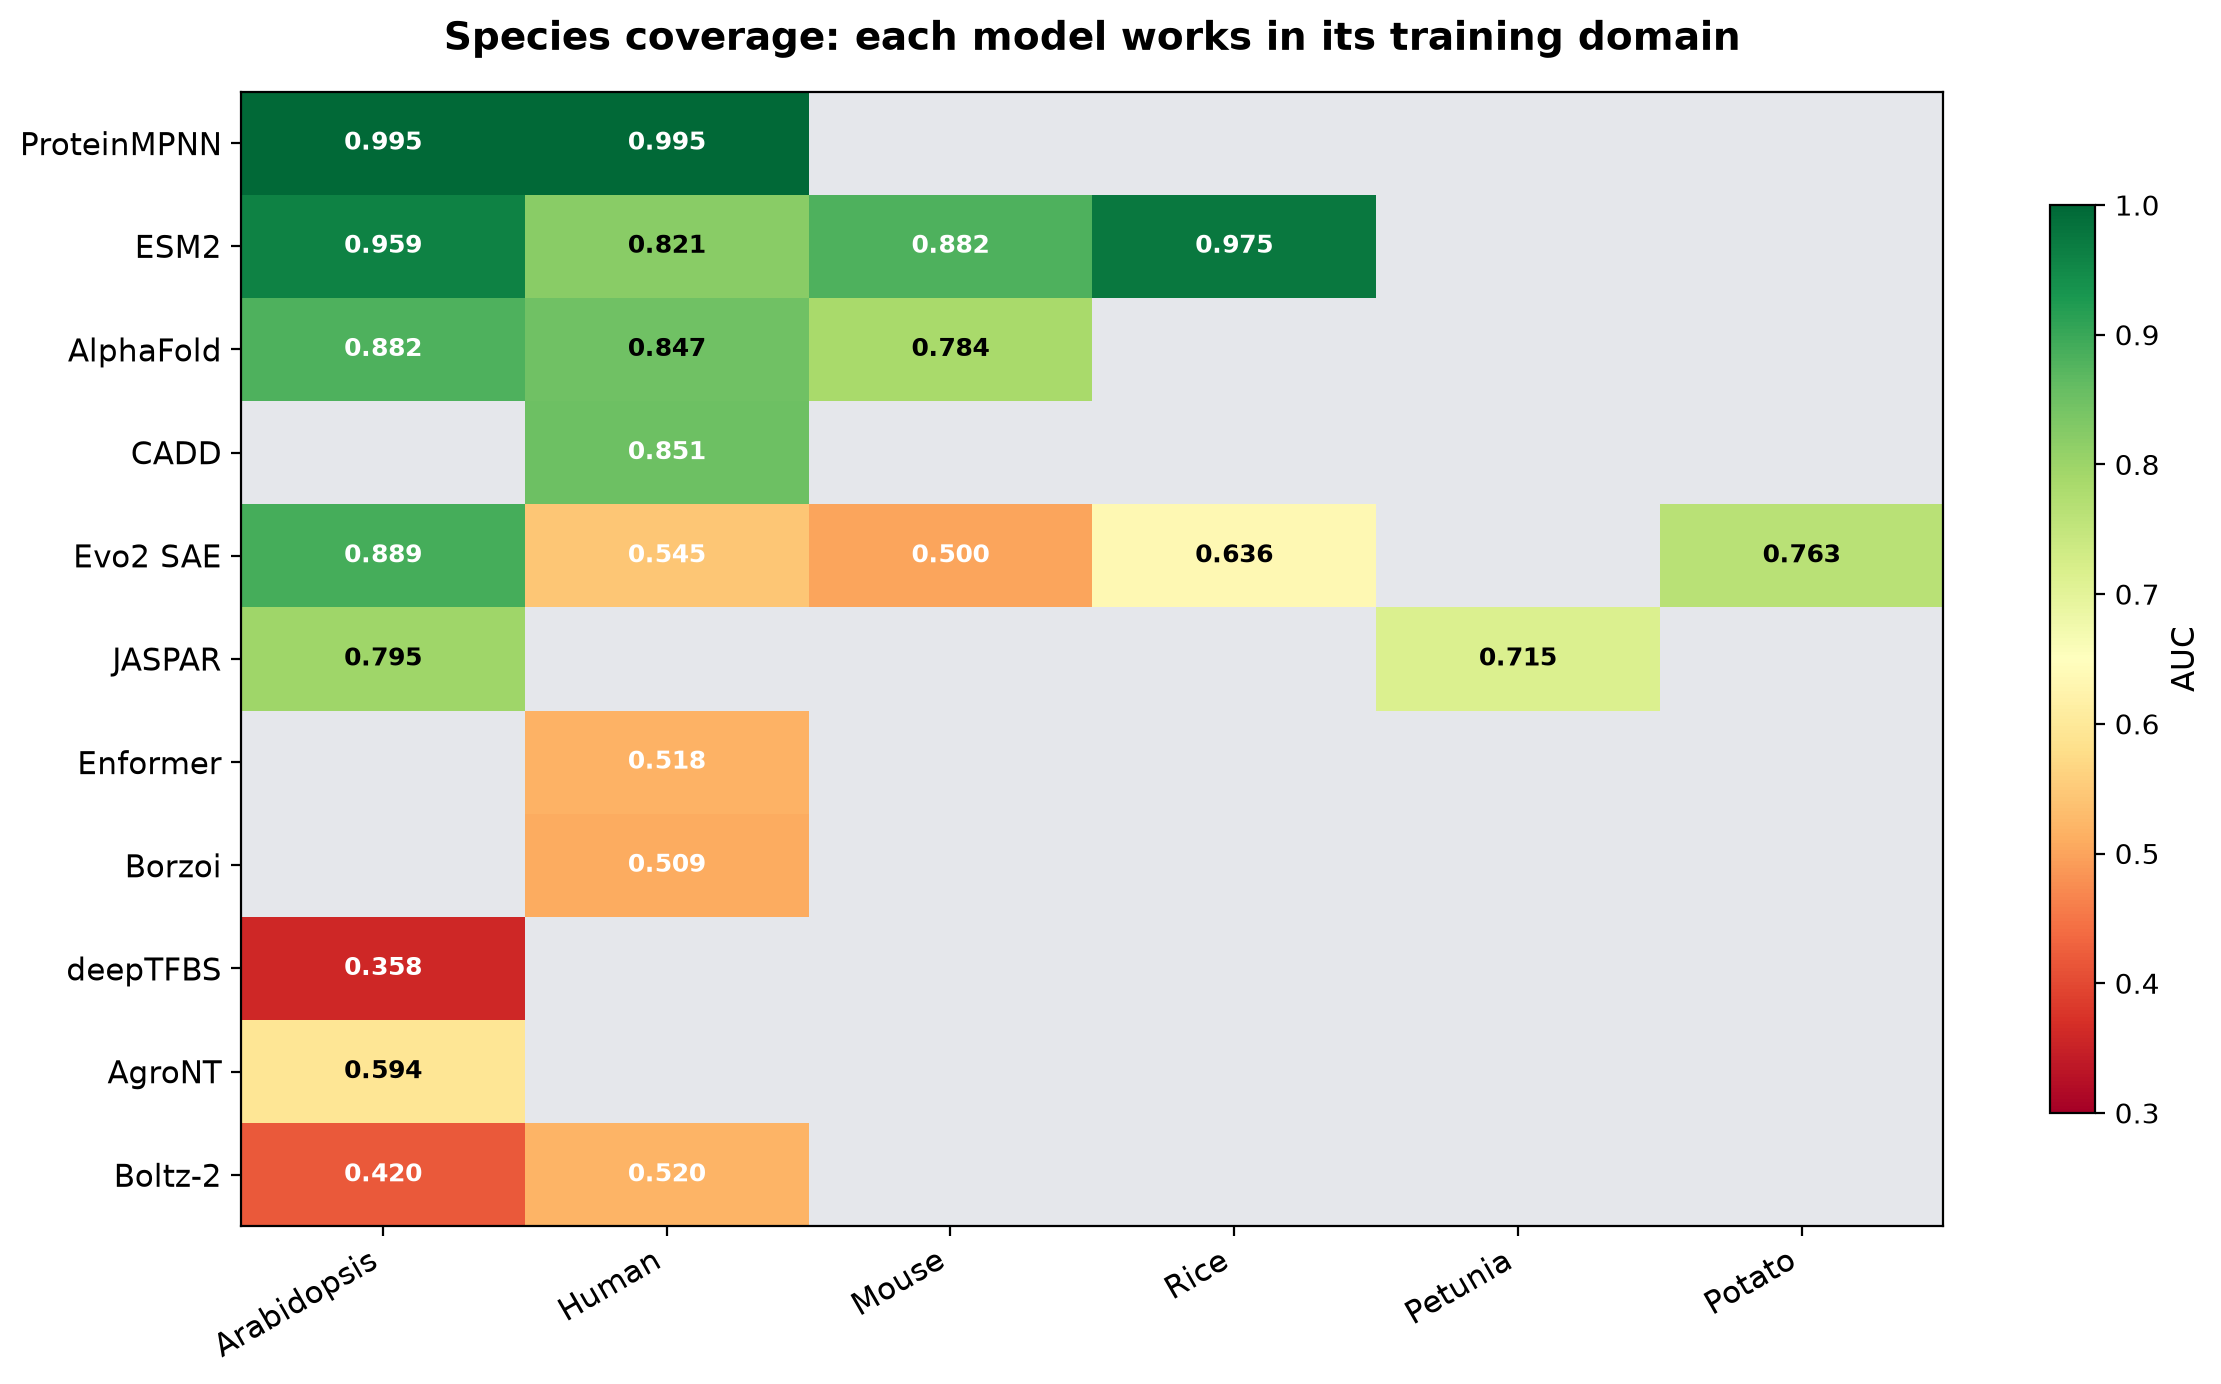
For non-model plant species, the toolkit remains thin. UniProt and Ensembl coverage declines outside major model organisms, limiting protein- and variant-based methods before model performance can even be evaluated.
Model Capability Summary
| Model | Best task | Best AUC | Predicts regulatory edges? |
|---|---|---|---|
| ProteinMPNN | TF vs enzyme designability | 0.995 | No |
| ESM2-650M | TF classification (rice) | 0.975 | No |
| Evo2 SAE | Species classification | 1.000 | No |
| AlphaFold DB | TF structural confidence | 0.882 | No |
| CADD v1.7 | TSS vs intergenic (human) | 0.851 | No |
| JASPAR | Binding prediction (Arabidopsis) | 0.795 | Partial: binding evidence only |
| AgroNT-1B | Binding (Arabidopsis) | 0.594 | No: overfits |
| Enformer | Binding (human) | 0.518 | No |
| Borzoi | Binding (human) | 0.509 | No |
| Evo2 linear probe | Binding | 0.500 | No |
| Boltz-2 | Binding | 0.420 | No |
| deepTFBS | Binding (Arabidopsis) | 0.358 | No: anti-discriminates |
What This Means
Deep learning has not solved gene regulation. It has produced useful tools for individual parts of the problem: ESM2 can validate and classify TF annotations; ProteinMPNN and AlphaFold can flag structurally atypical proteins and confirm TF characteristics; Evo2 can classify sequences and detect phylogenomic signatures; and JASPAR remains the most practical plant binding discriminator.
The regulatory edge — this TF controls that gene — still requires experimental evidence from perturbation experiments, chromatin accessibility, and expression time series. Models can annotate, classify, and validate. They do not yet replace the biology.
Methods
All calibrations used the GRN Atlas dataset: 162,000 candidate regulatory edges across eight species (human, mouse, Arabidopsis, tomato, petunia, pepper, potato, and rice).
Protein characterization: ESM2 and AlphaFold analyses used 5-fold stratified cross-validation with L1 logistic probes, a C sweep of 0.01, 0.1, 1.0, and 10.0, and n=50+50 per species. Features were 1,280-dimensional ESM2 embeddings and nine pLDDT-derived AlphaFold features.
ProteinMPNN: sequence recovery and perplexity were scored on AlphaFold-predicted structures using the v_48_020 checkpoint on an RTX 5070 Ti. The comparison included 29 Arabidopsis and human TFs and 20 human housekeeping enzymes.
Binding prediction: large-scale studies used n=50+50 controls and pilots n=20+20. Positive controls came from measured interactions including ConnecTF, AGRIS AtRegNet, and ChIP-seq; negatives were random TF-gene pairings excluding known edges.
CADD and Evo2: CADD v1.7 PHRED scores came from the REST API. Evo2 analyses used the 40B model, Goodfire SAE with 32K features, layer-26 hidden states with 8,192 dimensions, and 200 bp DNA windows.